World Marketing Company
Operations & Visibility Dashboards
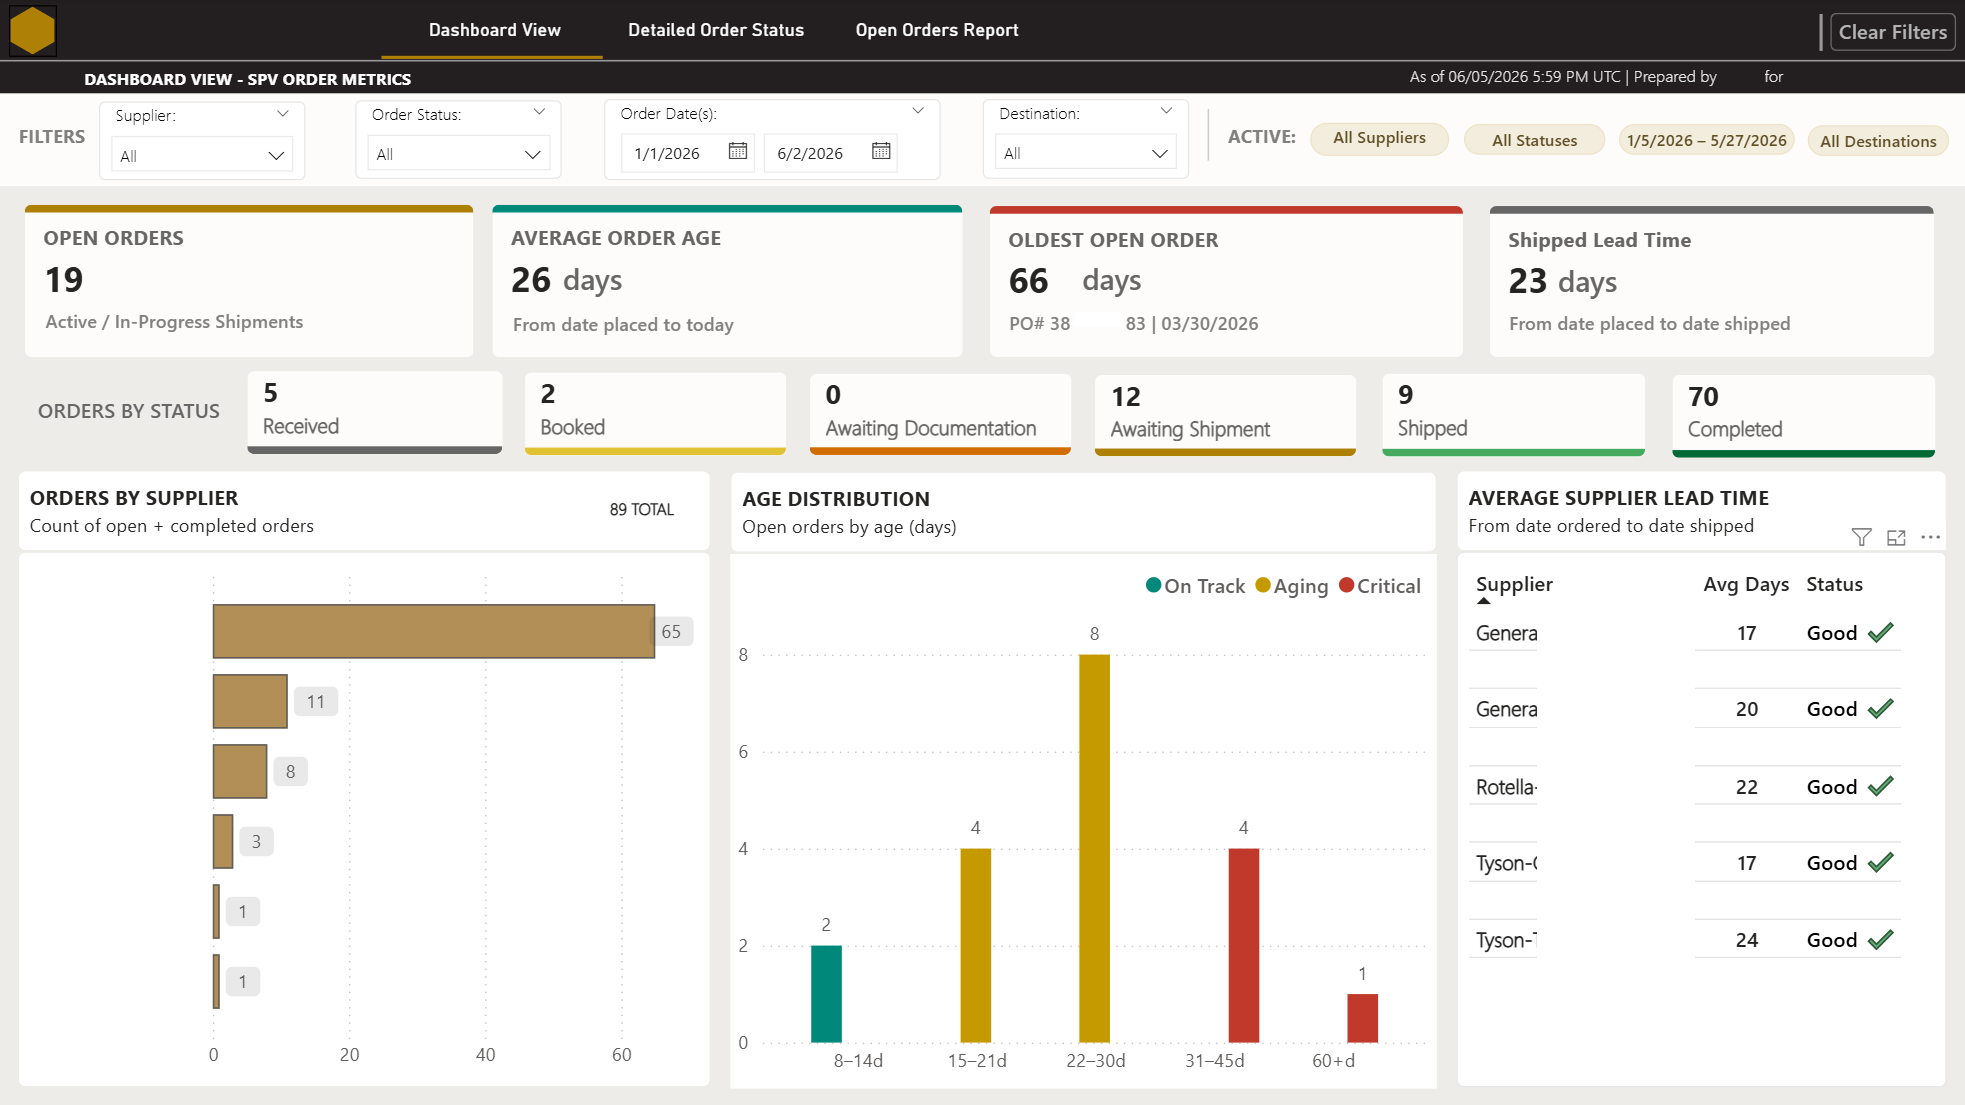
Dashboard Examples
Problem
Order data was scattered across multiple reports, making it difficult to identify potential issues in real-time. Due to the complexity of these reports, external colleagues were hesitant to use them, leading to a reliance on manual tracking and overlapping / redundant information.
Approach
Designed and built a suite of Power BI dashboards pulling from internal data sources to surface order status and aging, carrier loading appointments, supplier/manufacturer on-time performance, SKU/item trends and constrained inventory, service fees and cost-to-serve insights.
To solve this, I created a centralized dashboard for internal users, and a more user-friendly manufacturer-specific dashboard for external colleagues that provided performance insights, order-specific information, and real-time visibility.
Outcome
Dashboards became a daily operational tool used by both the Operations team and Leadership, eliminating reporting overlap and providing real-time visibility across the full order lifecycle.